
Reputation: 28907
Using color as the 3rd dimension
I have 3 dimensions that I want to plot, and I want the third dimension to be color.
This will be in R by the way. For instance, my data looks like this
x = [1,2,3,4,1,5,6,3,4,7,8,9]
y = [45,32,67,32,32,47,89,91,10,12,43,27]
z = [1,2,3,4,5,6,7,8,9,10,11,12]
I am trying to use filled.contour, but it giving me an error saying x and y must be in increasing order. But I'm not really sure how to arrange my data such that that is true. Because if I arrange x in increasing order, then y will not be in increasing order.
It is also feasible for me to do a non-filled contour method where it is just data points that are colored. How can I do this in R. Any suggested packages? Please use specific examples. Thanks!
Upvotes: 4
Views: 2271
Answers (1)

Reputation: 263301
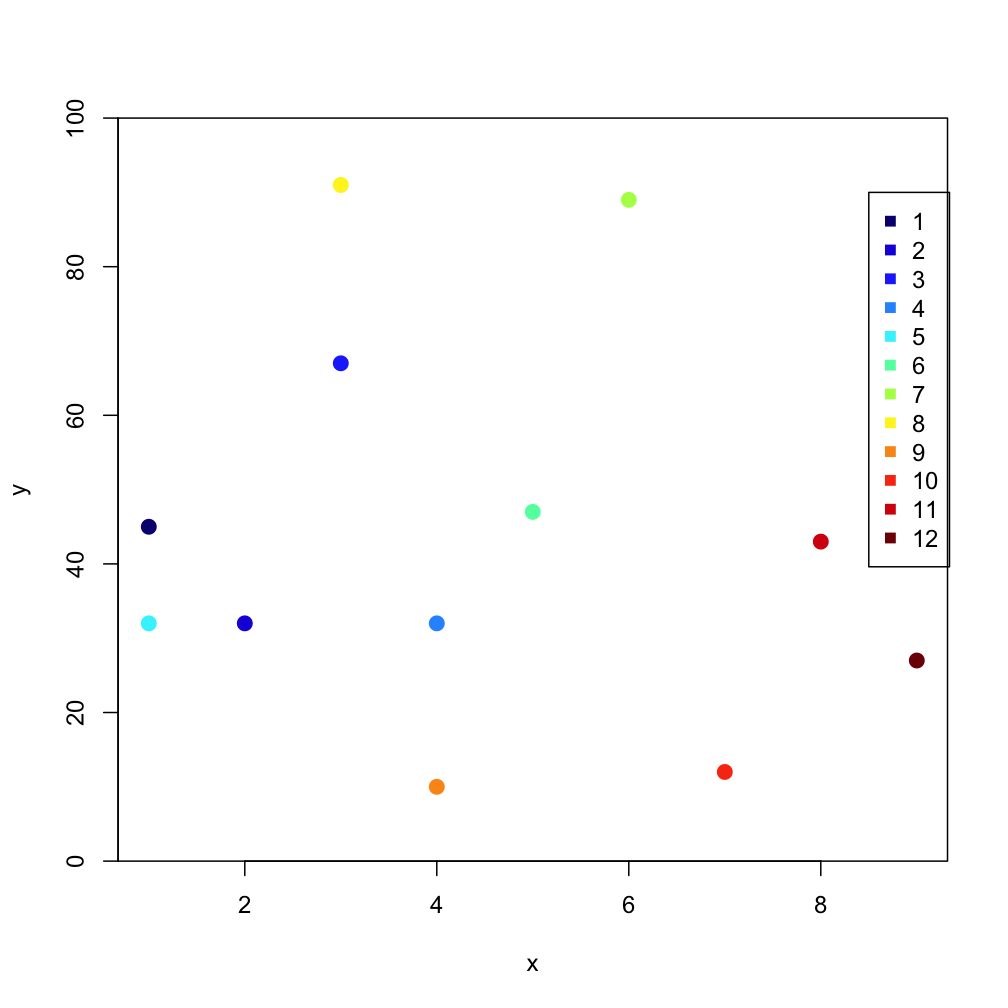
jet.colors <-
   colorRampPalette(c("#00007F", "blue", "#007FFF", "cyan",
                      "#7FFF7F", "yellow", "#FF7F00", "red", "#7F0000"))
plot(x,y, col=jet.colors(12)[z], ylim=c(0,100), pch=20, cex=2)
legend(8.5,90, col = jet.colors(12)[z], legend=z, pch=15)
And if you want to check the coloring you can label the points with the z value:
text(x, y+2, labels=z) #offset vertically to see the colors
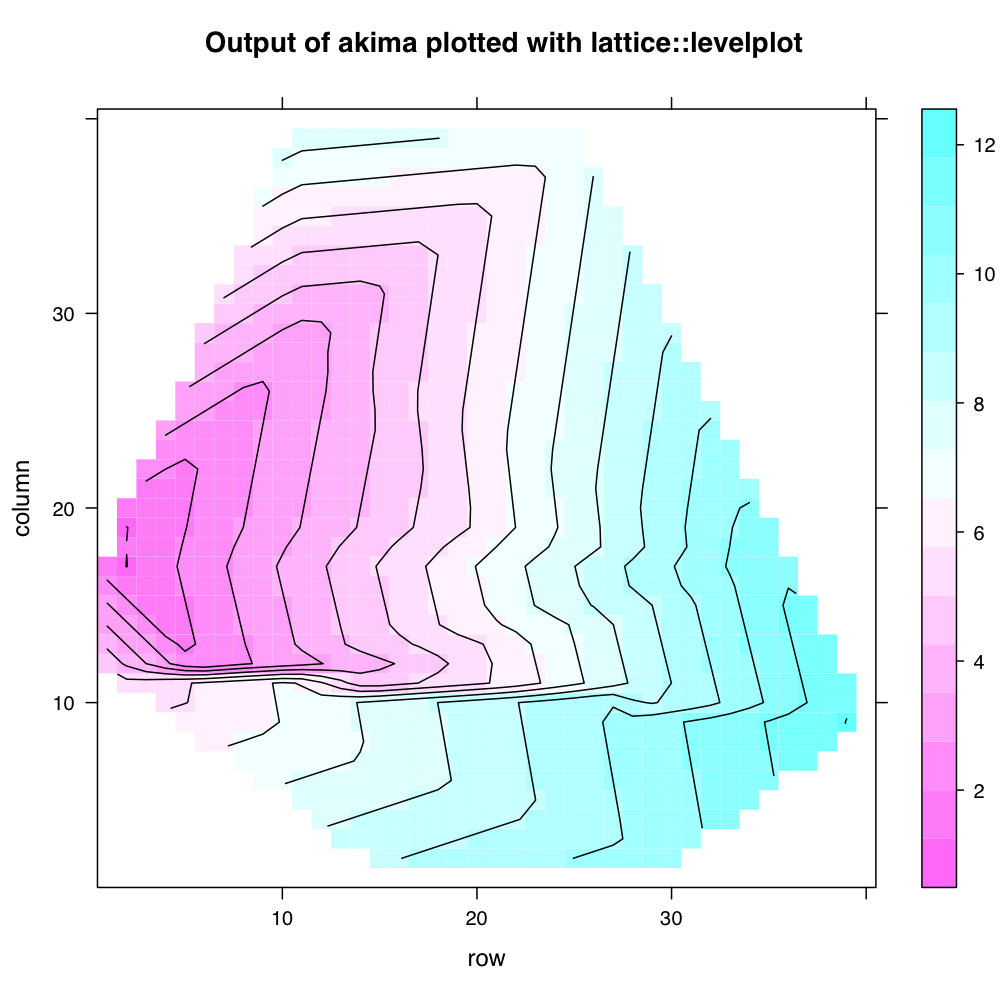
Another option is to use package:akima which does interpolations on irregular (non)-grids:
require(akima)
require(lattice)
ak.interp <- interp(x,y,z)
pdf(file="out.pdf")
levelplot(ak.interp$z, main="Output of akima plotted with lattice::levelplot", contour=TRUE)
 dev.off()
Upvotes: 5
Related Questions
- How to color the 3D plot based on values of variables in r
- Problem of coloring 3D scatterplot using "plot3D"
- R plot3d coloring
- Colour-coded 3D Plot in R
- 3D Visualization with color weights in R
- Defining color of 3D points plot based on distance in R
- R 3d plot with categorical colors
- R plot with color gradient
- Create 3D Plot Colored According to the Z-axis
- 3D Plotting in R - Using a 4th dimension of color