
Reputation: 2353
MATLAB - Plotting multiple graphs
I am new to MATLAB and am having difficulty plotting multiple graphs. Here are my vectors to graph:
S = [1.2421
2.3348
0.1326
2.3470
6.7389
3.7089
11.8534
-1.8708
...]
Y = [1.1718
1.8824
0.3428
2.1057
1.6477
2.3624
2.1212
-0.7971
...]
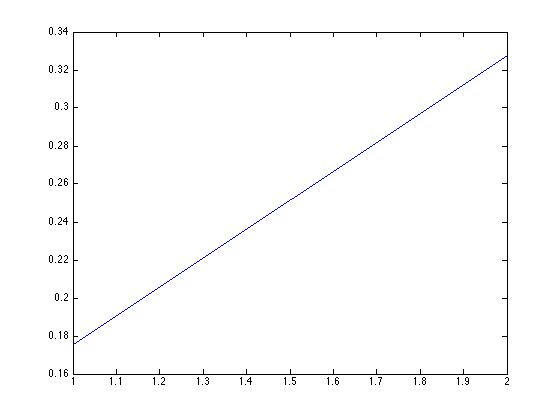
w = [0.1753
0.3277]
S is my training data and Y is my output vector. Then I add a column vector to my training data:
O = ones(length(S), 1)
X = [S 0]

w = inv(X'*X)*X'*Y
So I am trying to plot X, Y and w on the same graph. I plot w first, hold, X and this is where I get lost. Basically they are not on the same scale because the size of x is much less than X (X and Y are both vectors of size 100 and w is of size 2).
plot(w)
Then I do:
hold
plot(X)
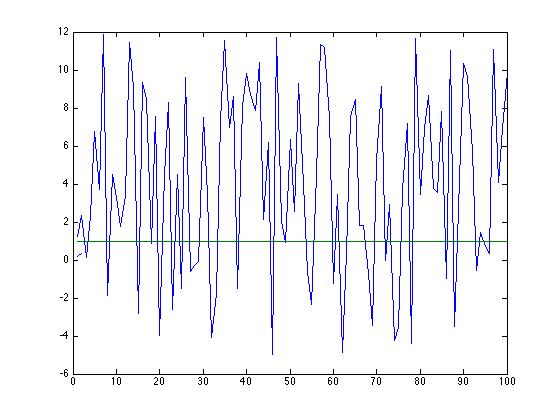
Now the w that I plotted is so small compared to the plot of X. How would I make them the same scale? Also maybe making them a different color?
Upvotes: 2
Views: 9892
Answers (2)

Reputation: 515
I'd just comment, but I don't have enough reputation... If you are not aiming to present the data, but just be able to visualize it, you can rescale your datasets and avoid the not-so-easy-to-work-with plotyy (although it is the best answer):
W = W/max(W);
X = X/max(X);
plot(W)
hold on
plot(X)
For additional formating of the plots, see mathworks polt. There you can change color, linewidth and whatnot.
Upvotes: 0

Related Questions
- Plotting multiple equations in MATLAB
- MatLab Plotting Multiple Data Sets (Same Graph)
- Matlab plotting, multiple plots with one script
- Plotting multiple graphs in a single window by using matlab
- Plotting multiple graphs in a specific figure in matlab
- Plotting a graph using matlab
- How to plot several graphs in same window in matlab
- matlab - graph plotting
- matlab - graph plotting
- plot multi graphs with 2 y axis in 1 graph