
Nick
Reputation: 5430
How do I plot a function and data in Mathematica?
Simple question but I can't find the answer.
I want to combine a ListLinePlot and a regular Plot (of a function) onto one plot. How do I do this?
Thanks.
Upvotes: 5
Views: 14843
Answers (2)

Chris Degnen
Reputation: 8645
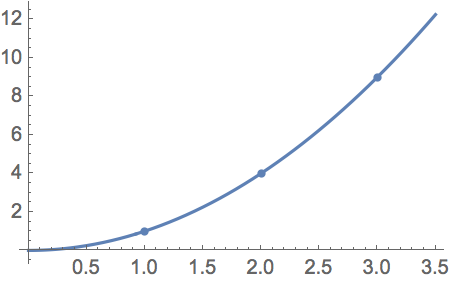
Use Show, e.g.
Show[Plot[x^2, {x, 0, 3.5}], ListPlot[{1, 4, 9}]]
Note, if plot options conflict Show uses the first plot's option, unless the option is specified in Show. I.e.
Show[Plot[x^2, {x, 0, 3.5}, ImageSize -> 100],
 ListPlot[{1, 4, 9}, ImageSize -> 400]]
shows a combined plot of size 100.
Show[Plot[x^2, {x, 0, 3.5}, ImageSize -> 100],
 ListPlot[{1, 4, 9}, ImageSize -> 400], ImageSize -> 300]
Shows a combined plot of size 300.
Upvotes: 13

Simon
Reputation: 14731
An alternative to using Show and combining two separate plots, is to use Epilog to add the data points to the main plot. For example:
data = Table[{i, Sin[i] + .1 RandomReal[]}, {i, 0, 10, .5}];
Plot[Sin[x], {x, 0, 10}, Epilog -> Point[data], PlotRange -> All]
or
Plot[Sin[x], {x, 0, 10}, Epilog -> Line[data], PlotRange -> All]
Upvotes: 5
Related Questions
- How to use plot function to plot results of your own function?
- Wolfram Alpha functions and plots
- Plot of function in Matlab
- How to plot this function?
- Plotting a function in R
- Plotting function in R
- Simple - Plotting a function
- Function plotting in MATLAB
- ListLinePlot function in mathematica
- plotting on the y-axis in Mathematica