
Reputation: 58501
Plotting surfaces with contour map in 3D over triangles
The example code here for rgl does almost what I want. However my (x,y) are not in a rectangle but in a triangle that is half of the rectangle (x=0..1, y=0..1 and z is missing if x+y>1).
My input dataset is in the following format:
x1 x2 x3 x4 x5 x6 z
and I would like to visualize (x4, x5, z) and (x2, x3, x6), etc. Any help is appreciated how to do this in R, I am beginner.
Can export the final plot into PDF, EPS or SVG?
UPDATE: OK, I see I can export to EPS.
UPDATE 2: Thanks to Carl I almost got what I want.
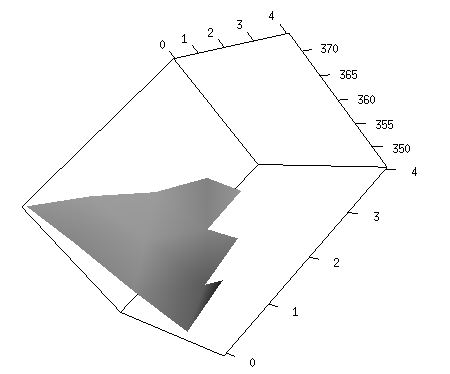
The only problem is that one of the edges of the surface is saw-toothed. Between the teeth, where x+y<=4 the surface should be kept so the saw-toothed edge becomes like the other edges. How can I do this?
The R code is below, the input data is here
library(rgl)
mat = matrix(scan("bpexamp.out"),ncol=9,byrow=T)
N <- 4
x <- c(0:N)
y <- c(0:N)
z <- mat[,9]
zlim <- range(y)
zlen <- zlim[2] - zlim[1] + 1
colorlut <- terrain.colors(zlen,alpha=0) # height color lookup table
col <- colorlut[ z-zlim[1]+1 ] # assign colors to heights for each point
open3d()
aspect3d(1,1,0.1)
surface3d(x, y, z, col)
axes3d()
Upvotes: 0
Views: 1259
Answers (1)

Reputation: 21532
This is a comment - but I don't know howto put an image into a comment, so formatted as an answer. I ran yr stuff and got this chart:
I ran yr stuff and got this chart: 
So, what is missing or inaccurate here? We can probably 'fix' it for you...
Upvotes: 1
Related Questions
- Is there a way to create a 3d plot with contours beneath the plot in R?
- Plotting a 3D surface plot with contour map overlay, using R
- 3d graph with contours lines
- 3D Data with ggplot
- Plot a generic surface and contour in R
- Plotting a 3D surface in R
- 3D surface plot in R
- How to create a 3 D surface plot
- How do I create a 3D surface plot in R?
- r : 3D surface plot