
Reputation: 179388
Is it possible to update a lattice panel in R?
The update method of trellis plots allows one to modify a lattice plot after the initial call. But the update behaviour is more like replace than append. This differs from the ggplot2 idiom where each new layer is additive to what exists already. Is it possible to get this additive behaviour using lattice?
An example:
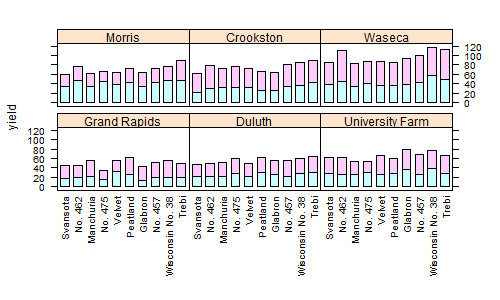
LL <- barchart(yield ~ variety | site, data = barley,
        groups = year, stack = TRUE,
        between=list(y=0.5),
        scales = list(x = list(rot = 90)))
print(LL)
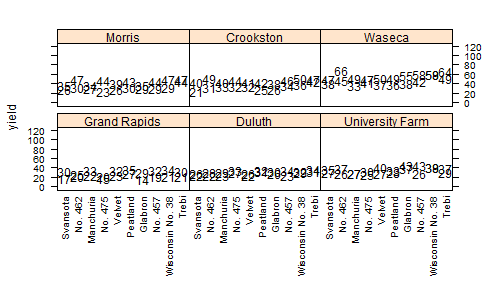
Now I want to add panel.text to the existing plot. Using update in the following way doesn't work:
update(LL, panel=function(...){
           args <- list(...); panel.text(args$x, args$y+2, round(args$y, 0))
         })
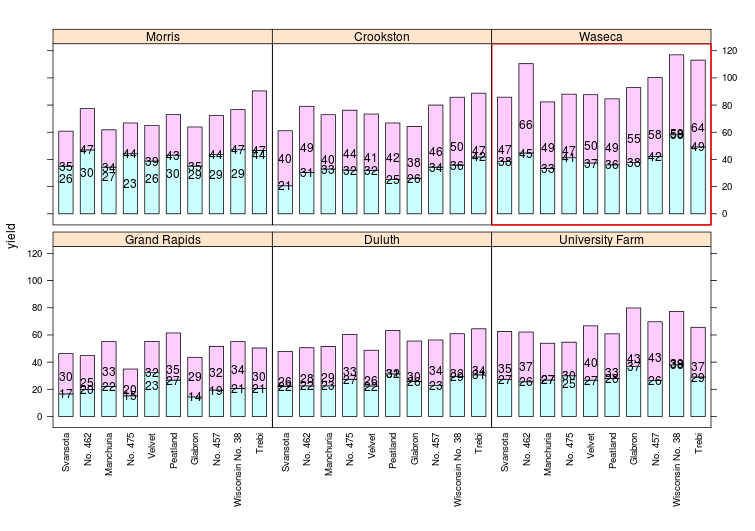
I know that I can use update by specifying all of the layers in the panel function:
update(LL, panel=function(...){
           args <- list(...)
           panel.barchart(...)
           panel.text(args$x, args$y+2, round(args$y, 0))
         })
This will work, but requires that I know what is already in the lattice plot - or that I refactor my code quite substantially.
Question: Is there a way of adding to the existing panel in update.trellis?
Upvotes: 11
Views: 2405
Answers (2)

Reputation: 6660
Here is a way to do it without latticeExtra. Admittedly, it's more complicated and difficult than the latticeExtra route. However, the flexibility with this trellis.focus method might be more useful in other contexts.
barchart(yield ~ variety | site, data = barley,
               groups = year, stack = TRUE,
               between=list(y=0.5),
               scales = list(x = list(rot = 90)))

panels  = trellis.currentLayout()
for( i in seq_along(panels) ) {
  ind = which( panels == i, arr.ind=TRUE )
  trellis.focus("panel",ind[2],ind[1])
  vars = trellis.panelArgs()
  panel.text(vars$x,vars$y,round(vars$y,0))
}
Upvotes: 4

Reputation: 37734
See layer from the latticeExtra package.
library(lattice)
library(latticeExtra)
LL <- barchart(yield ~ variety | site, data = barley,
        groups = year, stack = TRUE,
        between=list(y=0.5),
        scales = list(x = list(rot = 90)))
LL + layer(panel.text(x, y, round(y, 0), data=barley))
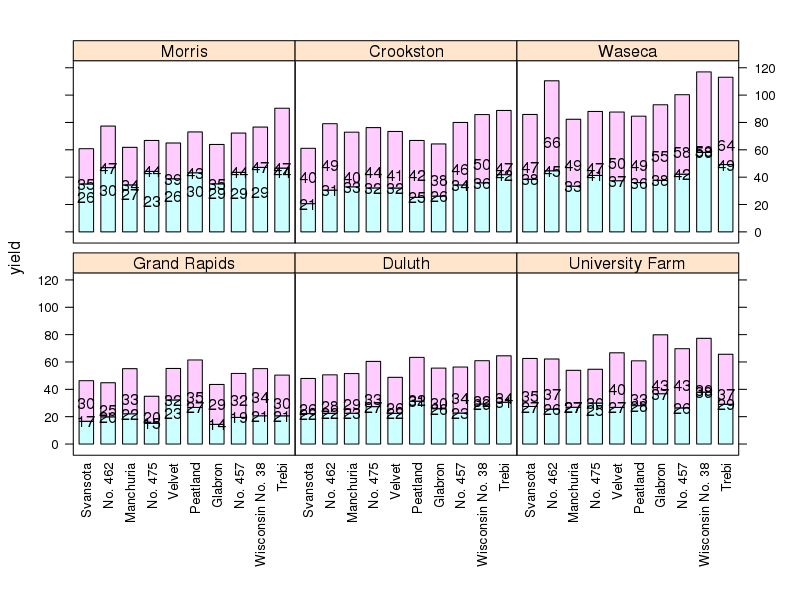
Upvotes: 14
Related Questions
- Change the graphic using the lattice package
- Add different unique labels to each panel in lattice
- How do I change the axis on a single panel in a lattice plot
- Panel plot using lattice package in R
- R: Lattice Plots/Wireframe : Splitting Panel Plots into single plots
- Adding text to different panels in lattice when scales are separate?
- Adding a custom LOESS panel to lattice plot in R
- Change the size of plot panel in lattice plot
- How to add points to multi-panel Lattice graphics bwplot?
- Controlling the number of panels in a lattice plot with R