
Reputation: 865
How to change data points color based on some variable
I have 2 variables (x,y) that change with time (t). I want to plot x vs. t and color the ticks based on the value of y. e.g. for highest values of y the tick color is dark green, for lowest value is dark red, and for intermediate values the color will be scaled in between green and red.
Can this be done with matplotlib in python?
Upvotes: 69
Views: 171336
Answers (2)

Reputation: 284602
This is what matplotlib.pyplot.scatter is for.
If no colormap is specified, scatter will use whatever the default colormap is set to. To specify which colormap scatter should use, use the cmap kwarg (e.g. cmap="jet").
As a quick example:
import matplotlib.pyplot as plt
import matplotlib.colors as mcolors
import numpy as np
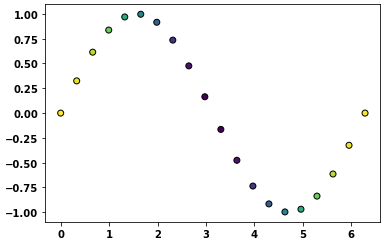
# Generate data...
t = np.linspace(0, 2 * np.pi, 20)
x = np.sin(t)
y = np.cos(t)
plt.scatter(t, x, c=y, ec='k')
plt.show()
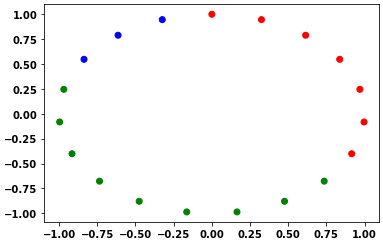
One may specify a custom color map and norm
cmap, norm = mcolors.from_levels_and_colors([0, 2, 5, 6], ['red', 'green', 'blue'])
plt.scatter(x, y, c=t, cmap=cmap, norm=norm)
Upvotes: 107

Reputation: 2787
If you want to plot lines instead of points, see this example, modified here to plot good/bad points representing a function as a black/red as appropriate:
def plot(xx, yy, good):
    """Plot data

    Good parts are plotted as black, bad parts as red.

    Parameters
    ----------
    xx, yy : 1D arrays
        Data to plot.
    good : `numpy.ndarray`, boolean
        Boolean array indicating if point is good.
    """
    import numpy as np
    import matplotlib.pyplot as plt
    fig, ax = plt.subplots()
    from matplotlib.colors import from_levels_and_colors
    from matplotlib.collections import LineCollection
    cmap, norm = from_levels_and_colors([0.0, 0.5, 1.5], ['red', 'black'])
    points = np.array([xx, yy]).T.reshape(-1, 1, 2)
    segments = np.concatenate([points[:-1], points[1:]], axis=1)
    lines = LineCollection(segments, cmap=cmap, norm=norm)
    lines.set_array(good.astype(int))
    ax.add_collection(lines)
    plt.show()
Upvotes: 15
Related Questions
- Changing colors for data points in Matplotlib
- How can I change the colors of a chart's data points depending on the value of the Y-axis? (Python: Matplotlib)
- How to Color Specific Data Points on a Plot Based on Column Value in Pandas Dataframe
- Coloring points based on a variable value
- Changing chart column color based off data
- Different colors for different datapoints for matplotlib
- How to color points base on other values in matplotlib?
- how to color data points based on some rules in matplotlib
- Python matplotlib scatter plot : changing colour of data points based on given conditions
- How to plot points in different color?