
Reputation: 2811
SSRS chart does not show all labels on Horizontal axis
My SSRS report does not show all the labels on the horizontal axis. Please see below.
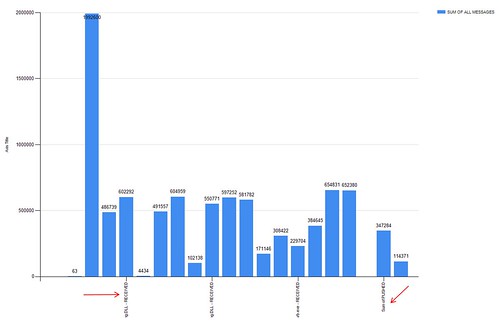
Note how the red arrows point to the few that do show. So my question is, where are the rest of the labels? Each bar should have one.
For the chart I'm adding number data for the bars, and another field for the Category Groups. That field in Category Group is for the labels.
Does anyone know why some are missing?
Also, a second but less important question, why is the order of the bars not the same order as the dataset?
Upvotes: 129
Views: 149244
Answers (6)

Reputation: 31
Really late reply for me, but I just suffered the pain of this problem as well.
What fixed it for me (after trying the Axis label settings and intervals from those screens, none of which worked!) was select the Horizontal Axis, then when you can see all the properties find Labels, and change LabelInterval to 1.
For some reason when I set this from the pop up properties screens it either never 'stuck' or it changes a slightly different value that didn't fix my issue.
Upvotes: 3

Reputation: 657
image: reporting services line chart horizontal axis properties
To see all dates on the report; Set Axis Type to Scalar, Set Interval to 1 -Jump Labels section Set disable auto-fit set label rotation angle as you desire.
These would help.
Upvotes: 2

Reputation: 2088
(Three years late...) but I believe the answer to your second question is that SSRS essentially treats data from your datasets as unsorted; I'm not sure if it ignores any ORDER BY in the sql, or if it just assumes the data is unsorted.
To sort your groups in a particular order, you need to specify it in the report:
- Select the chart,
- In the Chart Data popup window (where you specify the Category Groups), right-click your Group and click Category Group Properties,
- Click on the Sorting option to see a control to set the Sort order
For the report I just created, the default sort order on the category was alphabetic on the category group which was basically a string code. But sometimes it can be useful to sort by some other characteristic of the data; for example, my report is of Average and Maximum processing times for messages identified by some code (the category). By setting the sort order of the group to be on [MaxElapsedMs], Z->A it draws my attention to the worst-performing message-types.

This sort of presentation won't be useful for every report but it can be an excellent tool to guide readers to have a better understanding of the data; though on other occasions you might prefer a report to have the same ordering every time it runs, in which case sorting on the category label itself may be best... and I guess there are circumstances where changing the sort order could harm understanding, such as if the categories implied some sort of ordering (such as date values?)
Upvotes: 3

Reputation: 171
Go to Horizontal axis properties,choose 'Category' in AXIS type,choose "Disabled" in SIDE Margin option
Upvotes: 17

Reputation: 3750
The problem here is that if there are too many data bars the labels will not show.
To fix this, under the "Chart Axis" properties set the Interval value to "=1". Then all the labels will be shown.
Upvotes: 298
Reputation:
It looks as though the horizontal axis (Category Group) labels have very long values - there may not be room to display them all. I suggest changing the labels to have shorter values.
You can set the sort order for the Category Groups in the Category Group Properties - Sorting section - this may have been previously set; if not, I suggest using this to sort as desired.
Upvotes: 5
Related Questions
- SSRS no data label for 100% chart
- How to set custom horizontal axis interval in SSRS chart? It always shows every other label
- SSRS Chart Horizontal Label Height Issue
- SSRS multi axis chart issue
- SSRS bar chart issue
- SSRS Not showing all column labels
- Cannot see all the labels on the x asis in an ssrs column chart
- Not all labels on x-axis are showing in sql server 2008 report
- Data Labels Being Swallowed in Area Chart in SSRS 2008
- SSRS Chart Column Titles Missing