
Reputation: 4340
Java data visualization
I'm going to write an application, that will visualize data. And I have an idea for it but not quite sure if it is achievable. So, what my program is supposed to do:
- Read in data (easy part).
- Calculate the required things.
- Visualize the data like that (http://www.upload.ee/image/4548742/example.png).
- Now here comes the tricky part. The main diagonal and data below that is just numbers, that should be easy. But above the main diagonal there are small charts and I want them to be clickable. If I click them, an image pops up (the same chart enlarged) and that could also be closed from the X button. The thing is that the small chart should must be done from the calculations as well. So I pretty much need clickable charts in one window.
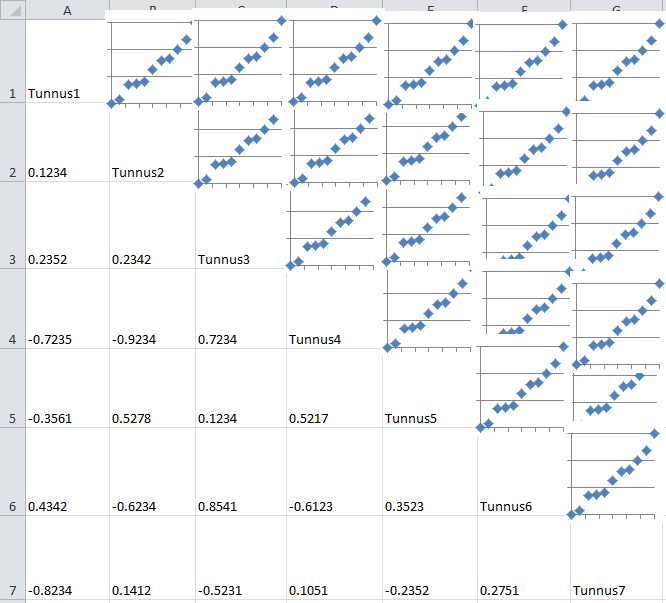
Does anybody have any idea is that even achievable and reasonable? If yes, then how? Do any of the chart libraries like JFreeChart support functionality like that?
Feel free to ask supporting questions.
Upvotes: 1
Views: 1768
Answers (3)

Reputation: 1
I was facing the same problem to identify good visualization libraries in Java. Here a short list of my favorites:
Otherwise, store the data in a csv file and use directly D3, Plotly or Python for visualization.
Upvotes: 0

Reputation: 27767
My recommendation is to build up your backend in Java, e.g. Spring Boot, shove the data to a browser-based front-end and then unleash a library like D3 on it. Data viz in the browser is far more advanced and portable.
Upvotes: 1

Reputation: 205875
Use a GridLayout for the enclosing panel. Add instances of ChartPanel or JLabel as indicated. Override getPreferredSize(), as suggested here, to let the chart define the unit size. Add a ChartMouseListener, as suggested here, to detect clicks in the charts. In the listener, add the chart to a suitable modal dialog, e.g. JOptionPane.
Upvotes: 1
Related Questions
- Create stylish charts in Java eg with JFreeChart
- Real-time graphing in Java
- Problem implementing JFreeChart
- jfree charts sample tutorial
- Jfreechart dynamic charts
- Java JFreeChart with dynamic data
- How to create a Chart Explorer with Java and JFreeChart?
- JFreeChart for dynamic xy plots in java swing gui application
- Java Free Chart Question
- Dynamic graphing using Jfreechart