
Reputation: 353
Create stylish charts in Java eg with JFreeChart
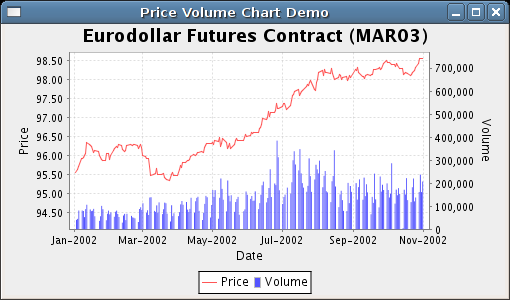
What's the best way to create great looking charts in Java? It looks like the main option for charting is JFreeChart, but unfortunately by default they come out looking quite plain.
Compare a sample of JFreeChart: http://www.jfree.org/jfreechart/images/PriceVolumeDemo1.png with one of the Javascript charting libraries, eg http://www.highcharts.com/demo/spline-symbols/grid or http://people.iola.dk/olau/flot/examples/graph-types.html
The javascript ones look nicer - they have smooth lines, nice font by default, and just overall look good compared to JFreeChart which looks very plain.
Is there a charting library built on top of JFreeChart that looks good by default, or maybe some sample code to make a normal JFreeChart chart (eg line chart) look great?
Upvotes: 8
Views: 13181
Answers (5)

Reputation: 9
The above code works fine if you will edit a little, but without BarRenderer. The edited code also works on pie charts & line charts.
StandardChartTheme theme = new StandardChartTheme(ch.toString());

theme.setTitlePaint( Color.decode( "#4572a7" ) );
theme.setRangeGridlinePaint( Color.decode("#C0C0C0"));
theme.setPlotBackgroundPaint( Color.BLACK );
theme.setChartBackgroundPaint( Color.BLACK );
theme.setGridBandPaint( Color.red );
theme.setAxisOffset( new RectangleInsets(0,0,0,0) );
theme.setBarPainter(new StandardBarPainter());
theme.setAxisLabelPaint( Color.decode("#666666")  );
theme.apply( ch );
ch.getCategoryPlot().setOutlineVisible( false );
ch.getCategoryPlot().getRangeAxis().setAxisLineVisible( false );
ch.getCategoryPlot().getRangeAxis().setTickMarksVisible( false );
ch.getCategoryPlot().setRangeGridlineStroke( new BasicStroke() );
ch.getCategoryPlot().getRangeAxis().setTickLabelPaint( Color.decode("#666666") );
ch.getCategoryPlot().getDomainAxis().setTickLabelPaint( Color.decode("#666666") );
ch.setTextAntiAlias( true );
ch.setAntiAlias( true );
ch.getCategoryPlot().getRenderer().setSeriesPaint( 0, Color.decode( "#4572a7" ));

// Note- The ch is a chart variable.
Upvotes: 0

Reputation: 20099
I had the same issue.
This code makes JFreeChart look like Highcharts (currently only barcharts are supported). It could easily be made more efficient :)
    String fontName = "Lucida Sans";
    JFreeChart chart = ChartFactory.createBarChart(null, "", "", dataset, PlotOrientation.VERTICAL, false, true, false );

    StandardChartTheme theme = (StandardChartTheme)org.jfree.chart.StandardChartTheme.createJFreeTheme();

    theme.setTitlePaint( Color.decode( "#4572a7" ) );
    theme.setExtraLargeFont( new Font(fontName,Font.PLAIN, 16) ); //title
    theme.setLargeFont( new Font(fontName,Font.BOLD, 15)); //axis-title
    theme.setRegularFont( new Font(fontName,Font.PLAIN, 11));
    theme.setRangeGridlinePaint( Color.decode("#C0C0C0"));
    theme.setPlotBackgroundPaint( Color.white );
    theme.setChartBackgroundPaint( Color.white );
    theme.setGridBandPaint( Color.red );
    theme.setAxisOffset( new RectangleInsets(0,0,0,0) );
    theme.setBarPainter(new StandardBarPainter());
    theme.setAxisLabelPaint( Color.decode("#666666")  );
    theme.apply( chart );
    chart.getCategoryPlot().setOutlineVisible( false );
    chart.getCategoryPlot().getRangeAxis().setAxisLineVisible( false );
    chart.getCategoryPlot().getRangeAxis().setTickMarksVisible( false );
    chart.getCategoryPlot().setRangeGridlineStroke( new BasicStroke() );
    chart.getCategoryPlot().getRangeAxis().setTickLabelPaint( Color.decode("#666666") );
    chart.getCategoryPlot().getDomainAxis().setTickLabelPaint( Color.decode("#666666") );
    chart.setTextAntiAlias( true );
    chart.setAntiAlias( true );
    chart.getCategoryPlot().getRenderer().setSeriesPaint( 0, Color.decode( "#4572a7" ));
    BarRenderer rend = (BarRenderer) chart.getCategoryPlot().getRenderer();
    rend.setShadowVisible( true );
    rend.setShadowXOffset( 2 );
    rend.setShadowYOffset( 0 );
    rend.setShadowPaint( Color.decode( "#C0C0C0"));
    rend.setMaximumBarWidth( 0.1);

Upvotes: 14

Reputation: 2755
Try out XChart. XChart is a light-weight Java library for plotting data that would be a potential alternative to JFreeChart. Its focus is on simplicity and doesn't have every capability that JFreeChart has, but it offers a rich set of charting features including Themes to apply different "skins" to a chart. You can easily create your own Theme by implementing an interface and applying it to a Chart by calling chart.setTheme(myTheme). The jar is only ~86 KB as of the 2.0.0 release, and it has no dependencies. It's licensed under Apache 2.0 and is hosted on Github. Some screenshots can be found here. Disclaimer: I'm the lead devloper of the project.

Upvotes: 9


Reputation: 3448
http://www.jfree.org/jfreechart/samples.html
There you can find many samples (you need to download a JFreeChart Demo (web start)). After some work with jFreeChart, I was thinking about moving to EasyChart (follow: http://www.objectplanet.com/easycharts/examples.html), but it looks very similar to jFreeChart actually. JFreeChart is quite easy to write, that I don't know about EasyChart.
But according to your question, there is no problem to change a Font, LineRenderer or anything from desing in JFreeChart, so you can modify it to look exactly like the one you've posted from JavaScript.
Upvotes: 3
Related Questions
- Java data visualization
- jfree charts sample tutorial
- Jfreechart dynamic charts
- Pretty pie charts in JFreechart
- Using jfreechart, how would I change the color and style of the series
- How to format a minimalist chart with jFreeChart?
- Java Visualisation / Charting library like Google Charts / Visualisation
- Change the Lines Style and colour of a JFreeChart
- Java User Interface: add simple chart
- jFreeChart: Is this kind of chart possible?