
Reputation: 21
Creating a hexagonal grid (u-matrix) in Python using a Regularpolycollection
I am trying to create a hexagonal grid to use with a u-matrix in Python (3.4) using a RegularPolyCollection (see code below) and have run into two problems:
The hexagonal grid is not tight. When I plot it there are empty spaces between the hexagons. I can fix this by resizing the window, but since this is not reproducible and I want all of my plots to have the same size, this is not satisfactory. But even if it were, I run into the second problem.
Either the top or right hexagons don't fit in the figure and are cropped.
I have tried a lot of things (changing figure size, subplot_adjust(), different areas, different values of d, etc.) and I am starting to get crazy! It feels like the solution should be simple, but I simply cannot find it!
import SOM
import matplotlib.pyplot as plt
from matplotlib.collections import RegularPolyCollection
import numpy as np
import matplotlib.cm as cm
from mpl_toolkits.axes_grid1 import make_axes_locatable

m = 3   # The height
n = 3   # The width

# Some maths regarding hexagon geometry
d = 10
s = d/(2*np.cos(np.pi/3))
h = s*(1+2*np.sin(np.pi/3))
r = d/2
area = 3*np.sqrt(3)*s**2/2

# The center coordinates of the hexagons are calculated.
x1 = np.array([d*x for x in range(2*n-1)])
x2 = x1 + r
x3 = x2 + r
y = np.array([h*x for x in range(2*m-1)])
c = []

for i in range(2*m-1):
    if i%4 == 0:
        c += [[x,y[i]] for x in x1]
    if (i-1)%2 == 0:
        c += [[x,y[i]] for x in x2]
    if (i-2)%4 == 0:
        c += [[x,y[i]] for x in x3]
c = np.array(c)

# The color of the hexagons
d_matrix = np.zeros(3*3)

# Creating the figure
fig = plt.figure(figsize=(5, 5), dpi=100)
ax = fig.add_subplot(111)

# The collection
coll = RegularPolyCollection(
    numsides=6,  # a hexagon
    rotation=0,
    sizes=(area,),
    edgecolors = (0, 0, 0, 1),
    array= d_matrix,
    cmap = cm.gray_r,
    offsets = c,
    transOffset = ax.transData,
)

ax.add_collection(coll, autolim=True)
ax.axis('off')
ax.autoscale_view()
plt.show()
Upvotes: 2
Views: 7609
Answers (2)

Reputation: 166
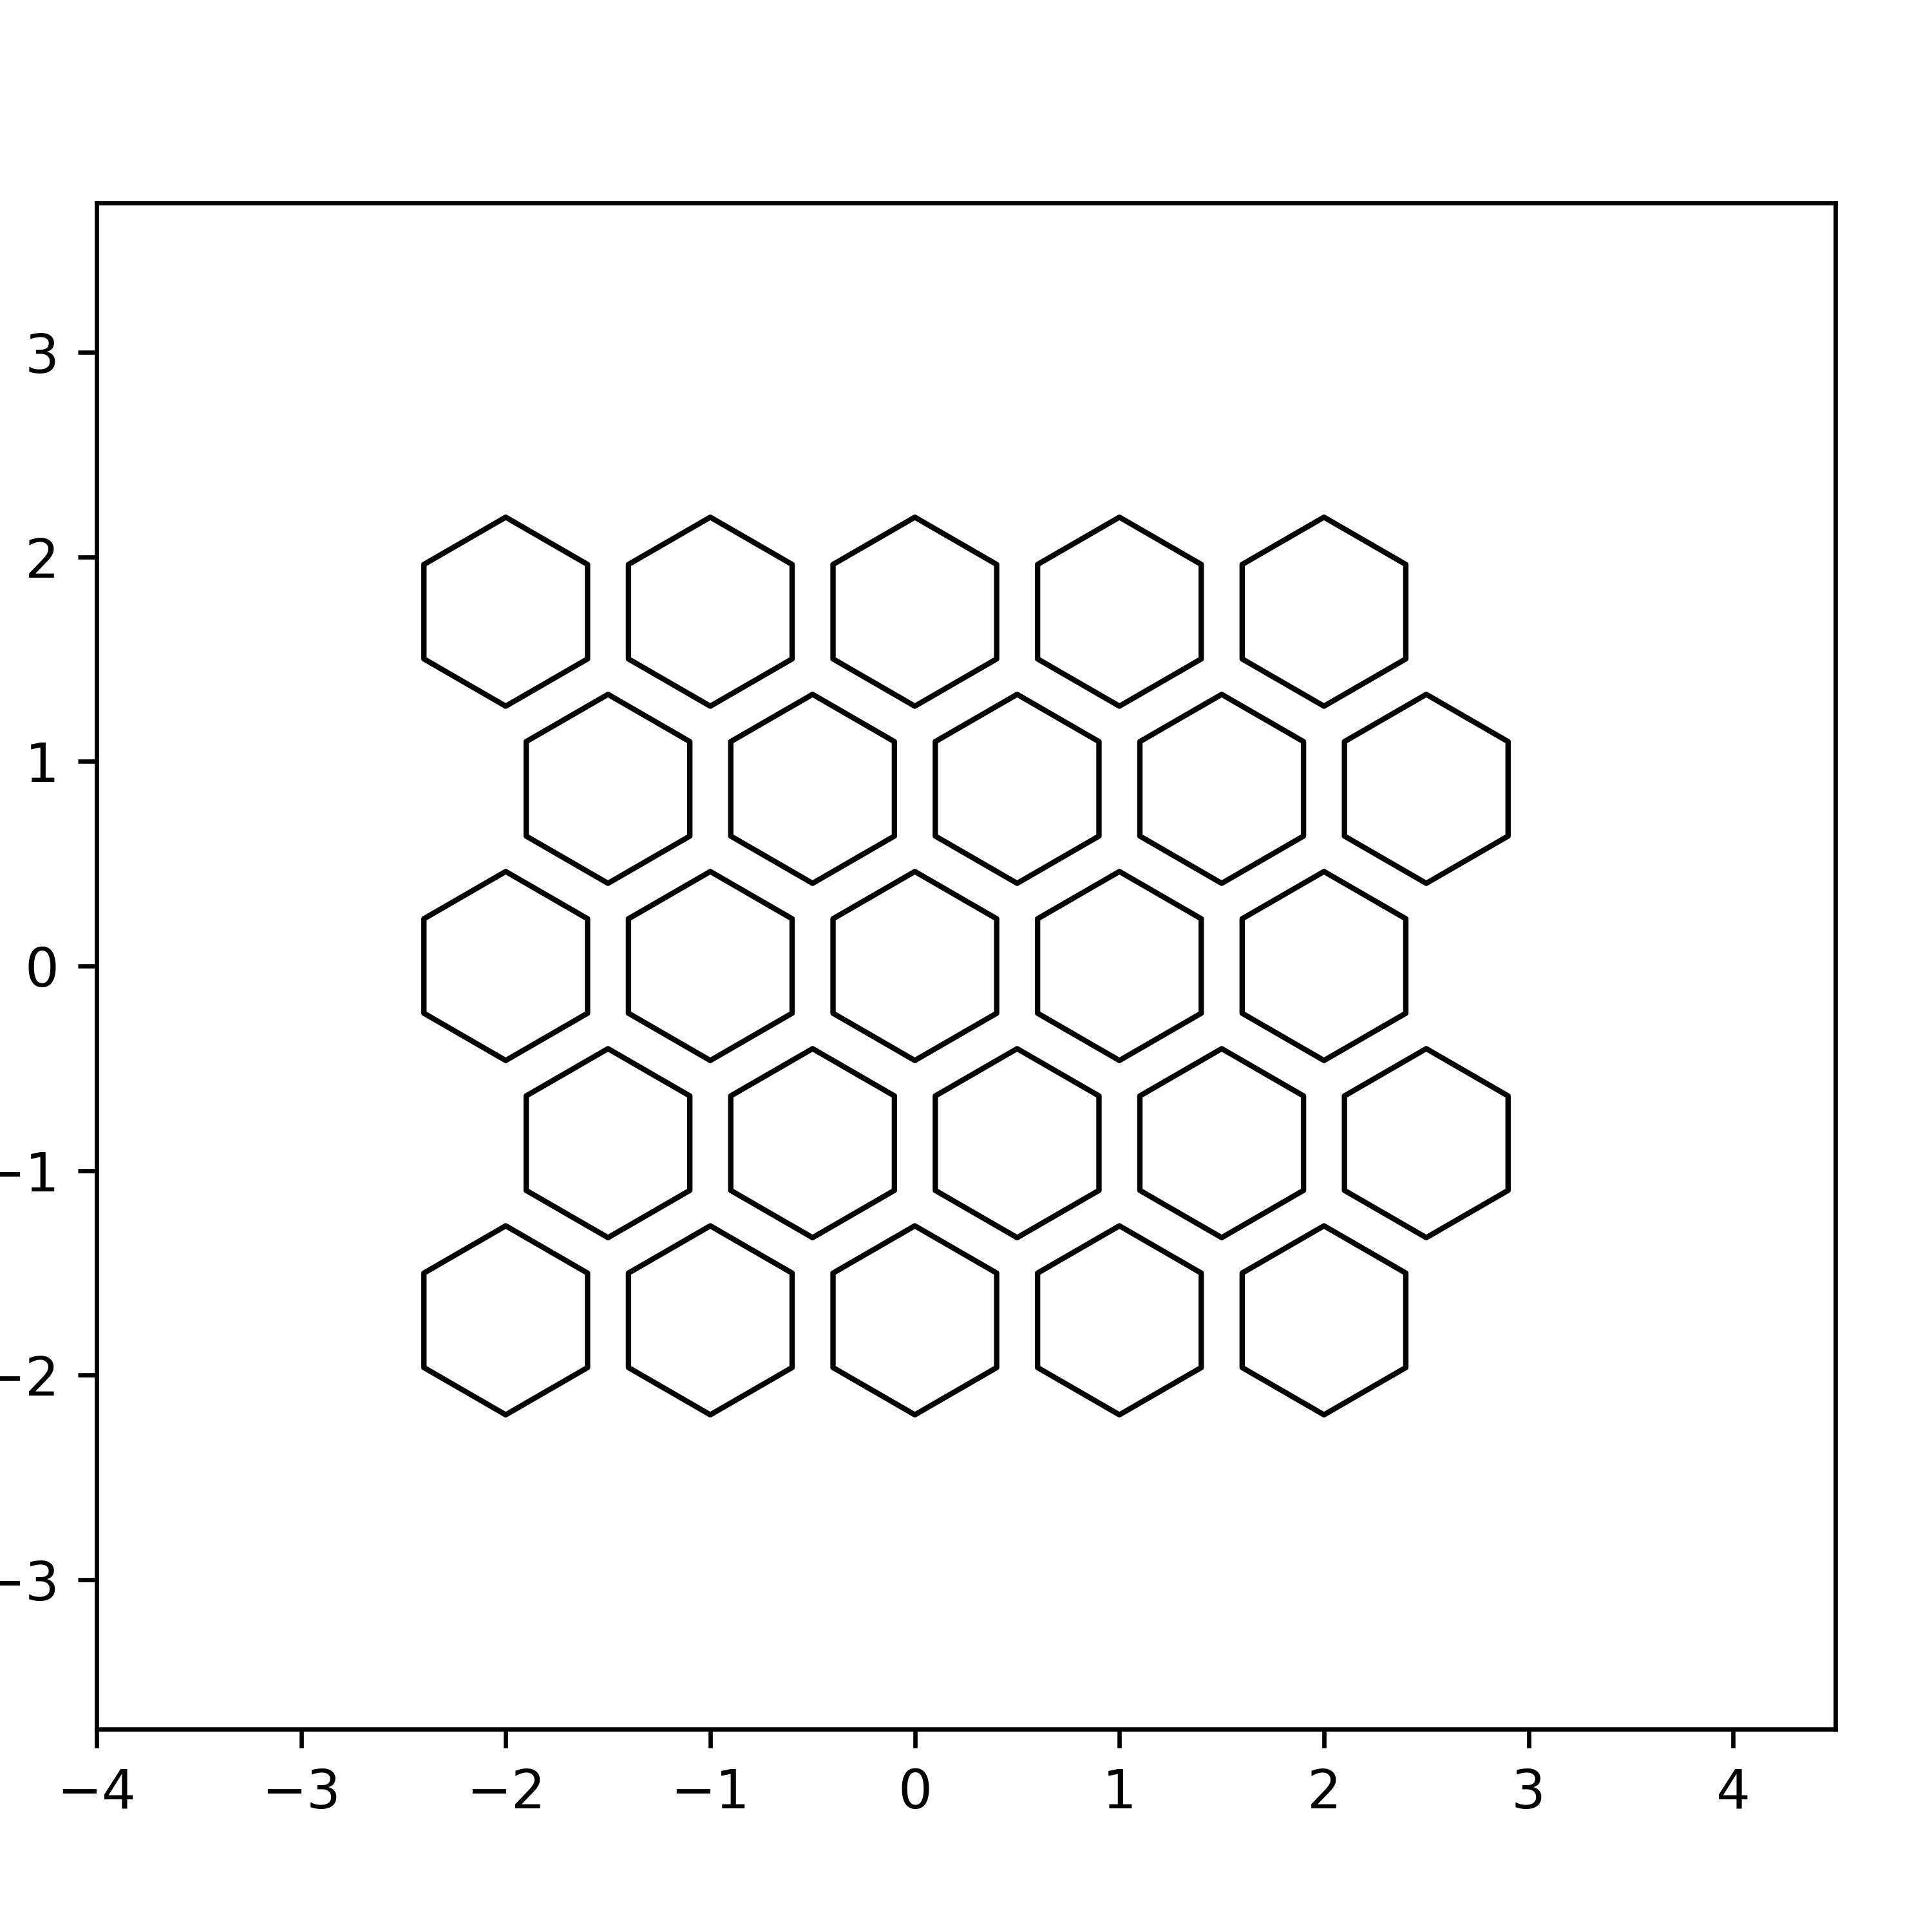
The hexalattice module of python (pip install hexalattice) gives solution to both you concerns:
Grid tightness: You have full control over the hexagon border gap via the 'plotting_gap' argument.
The grid plotting takes into account the grid final size, and adds sufficient margins to avoid the crop.
Here is a code example that demonstrates the control of the gap, and correctly fits the grid into the plotting window:
from hexalattice.hexalattice import *
create_hex_grid(nx=5, ny=5, do_plot=True)  # Create 5x5 grid with no gaps
create_hex_grid(nx=5, ny=5, do_plot=True, plotting_gap=0.2)

See this answer for additional usage examples, more images and links
Disclosure: the hexalattice module was written by me
Upvotes: 1

Reputation: 53
Also you need to add scale on axis like ax.axis([xmin, xmax, ymin, ymax])
Upvotes: 1
Related Questions
- Displaying data in a hexagonal grid using Python
- how to make a regular grid base on some irregular points in python
- map a hexagonal grid in matplotlib
- Displaying a hexagonal grid with matplotlib
- Faster way to calculate hexagon grid coordinates
- How to draw a 3D hexagonal grid in python
- Creating an N-dimensional grid with Python
- How to generate an n-dimensional grid in python
- Python, Matplotlib, plotting irregular grid
- Numpy Routine(s) to create a regular grid inside a 2d array