Reputation: 969
R ggplot by month and values group by Week
With ggplot2, I would like to create a multiplot (facet_grid) where each plot is the weekly count values for the month.
My data are like this :
   day_group count
1 2012-04-29   140
2 2012-05-06 12595
3 2012-05-13 12506
4 2012-05-20 14857
I have created for this dataset two others colums the Month and the Week based on day_group :
   day_group count Month Week
1 2012-04-29   140   Apr   17
2 2012-05-06 12595   May   18
3 2012-05-13 12506   May   19
4 2012-05-20 14857   May   2
Now I would like for each Month to create a barplot where I have the sum of the count values aggregated by week. So for example for a year I would have 12 plots with 4 bars (one per week).
Below is what I use to generate the plot :
ggplot(data = count_by_day, aes(x=day_group, y=count)) +
stat_summary(fun.y="sum", geom = "bar") +
scale_x_date(date_breaks = "1 month",  date_labels = "%B") +
facet_grid(facets = Month ~ ., scales="free", margins = FALSE)
So far, my plot looks like this https://dl.dropboxusercontent.com/u/96280295/Rplot.png
As you can see the x axes is not as I'm looking for. Instead of showing only week 1, 2, 3 and 4, it displays all the month.
Do you know what I must change to get what I'm looking for ?
Thanks for your help
Upvotes: 3
Views: 5930
Answers (2)

Reputation: 22817
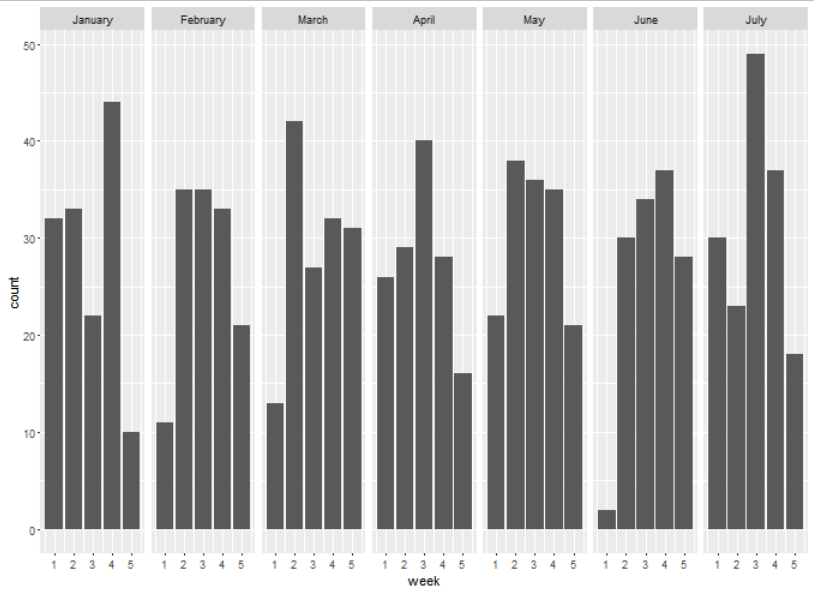
Okay, now that I see what you want, I wrote a small program to illustrate it. The key to your order of month problem is making month a factor with the levels in the right order:
library(dplyr)
library(ggplot2)

#initialization
set.seed(1234)
sday <- as.Date("2012-01-01")
eday <- as.Date("2012-07-31")

# List of the first day of the months
mfdays <- seq(sday,length.out=12,by="1 month")

# list of months - this is key to keeping the order straight
mlabs <- months(mfdays)

# list of first weeks of the months
mfweek <- trunc((mfdays-sday)/7)
names(mfweek) <- mlabs

# Generate a bunch of event-days, and then months, then week numbs in our range
n <- 1000
edf <-data.frame(date=sample(seq(sday,eday,by=1),n,T))
edf$month <- factor(months(edf$date),levels=mlabs)   # use the factor in the right order
edf$week <- 1 + as.integer(((edf$date-sday)/7) - mfweek[edf$month])

# Now summarize with dplyr
ndf <- group_by(edf,month,week) %>% summarize( count = n() )

ggplot(ndf) + geom_bar(aes(x=week,y=count),stat="identity")  + facet_wrap(~month,nrow=1)
Yielding:
(As an aside, I am kind of proud I did this without lubridate ...)
Upvotes: 5

Reputation: 686
I think you have to do this but I am not sure I understand your question:
ggplot(data = count_by_day, aes(x=Week, y=count, group= Month, color=Month))
Upvotes: 1
Related Questions
- Remove rows with all or some NAs (missing values) in data.frame
- How do I replace NA values with zeros in an R dataframe?
- How to change legend title in ggplot
- ggplot with 2 y axes on each side and different scales
- Rotating and spacing axis labels in ggplot2
- Remove legend ggplot 2.2
- Connecting means with stat_summary (geom = 'line') within ticks on the x-axis
- Implementing paired lines into boxplot.ggplot2
- R: Non-overlapping bars in same group ggplot
