
Reputation: 235
Semi donut chart in jfreechart
How to draw a semi do nut chart in jfreechart , For example use this below link, https://www.highcharts.com/demo/pie-semi-circle
This is my code
DefaultPieDataset dataset = new DefaultPieDataset( );

dataset.setValue("Safari-32", new Long( 32) );  dataset.setValue("Chrome-44", new Long( 44) );
dataset.setValue("Apple-24", new Long( 24) );
dataset.setValue("Google-75", new Long( 75) );
dataset.setValue("Michele", new Long( 97) );  dataset.setValue("Jony", new Long( 41) );

JFreeChart chart = ChartFactory.createRingChart("Chart title", dataset, true, false, false);
chart.setBackgroundPaint(Color.WHITE);
chart.setBorderVisible(false);

RingPlot plots = (RingPlot) chart.getPlot();

Font font3 = new Font("Book Antiqua", Font.BOLD, 17);


plots.setShadowPaint(null);
plots.setBackgroundPaint(null);
plots.setOutlineVisible(false);
plots.setLabelOutlinePaint(null);
plots.setLabelBackgroundPaint(Color.WHITE);
plots.setCenterTextMode(CenterTextMode.FIXED);
String te = "334";
plots.setCenterText((String)te); plots.setCenterTextFont(font3);
plots.setLabelGenerator(null);  // Remove the labels from chart area

font3 = new Font("Book Antiqua", Font.PLAIN, 10);
LegendTitle legend = chart.getLegend();
legend.setPosition(RectangleEdge.RIGHT); legend.setItemFont(font3);

legend.setBorder(0, 0, 0, 0);


String filename = "D:\\ad\\do nut.jpg";
ChartUtilities.saveChartAsJPEG(new File(filename), chart, 250, 155);
This is my code and this produces a full donut chart. I need a donut of starting angle from 180 degree to 0 degree
Upvotes: 0
Views: 1549
Answers (2)

Reputation: 205765
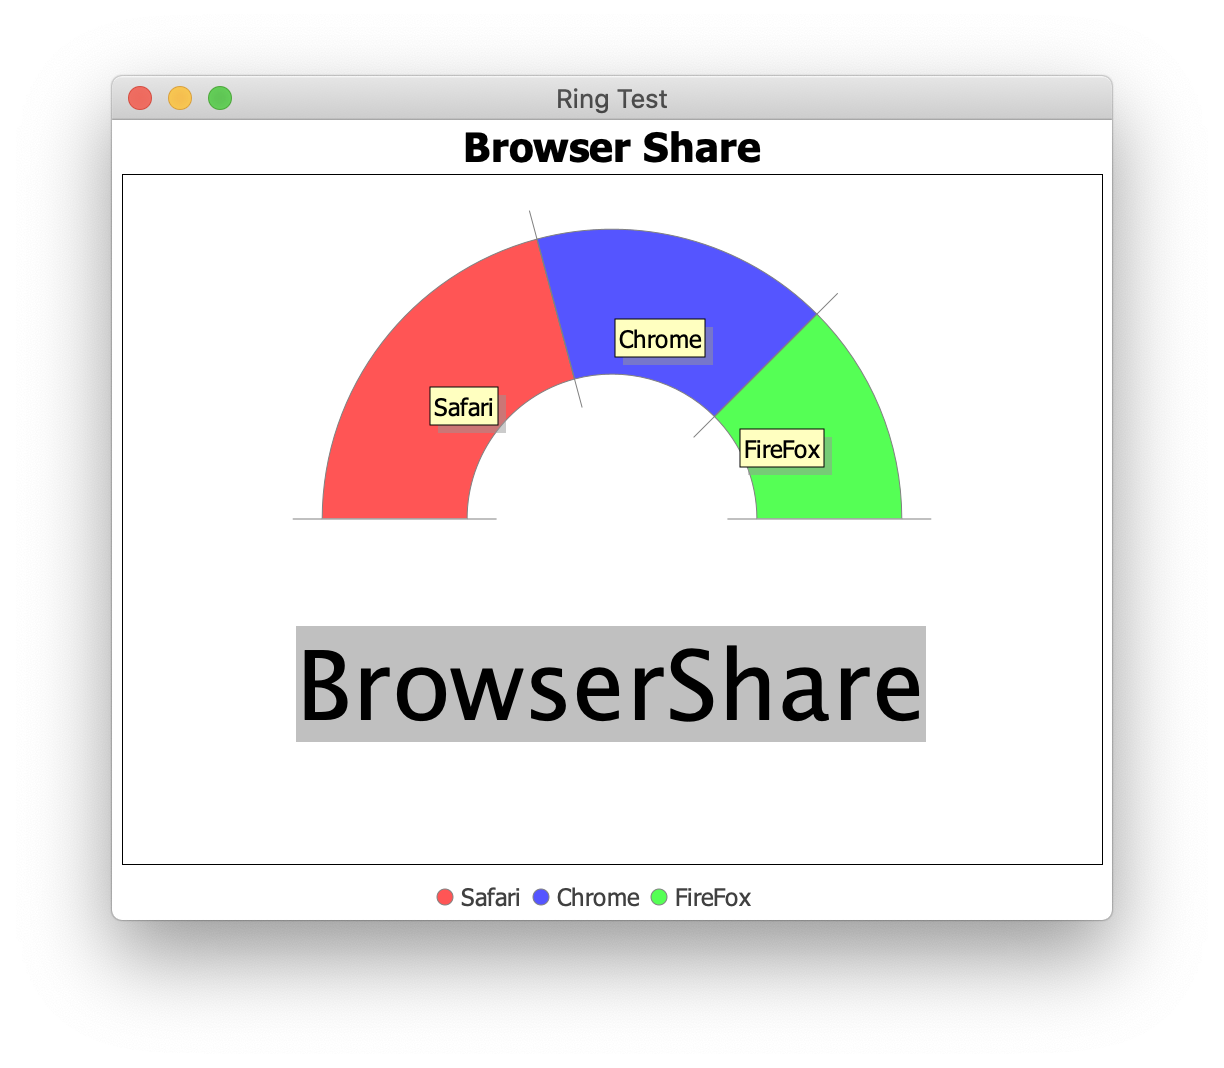
I need a donut of starting angle from 180 degree to 0 degree.
You can start at 180° using the parent PiePlot method setStartAngle(). You can hide the lower half using a transparent color, as shown here, or cover it using one of the approaches shown here. OverlayLayout and transparent white is illustrated below.
import java.awt.Color;
import java.awt.Dimension;
import java.awt.EventQueue;
import javax.swing.JFrame;
import javax.swing.JLabel;
import javax.swing.JPanel;
import javax.swing.OverlayLayout;
import org.jfree.chart.ChartFactory;
import org.jfree.chart.ChartPanel;
import org.jfree.chart.JFreeChart;
import org.jfree.chart.plot.RingPlot;
import org.jfree.data.general.DefaultPieDataset;
import org.jfree.data.general.PieDataset;

public class RingChartTest {

    private PieDataset createDataset() {
        DefaultPieDataset dataset = new DefaultPieDataset();
        dataset.setValue("Safari", 75);
        dataset.setValue("Chrome", 60);
        dataset.setValue("FireFox", 45);
        dataset.setValue("", 180);
        return dataset;
    }

    private JFreeChart createChart(PieDataset dataset) {
        JFreeChart chart = ChartFactory.createRingChart(
            "Browser Share", dataset, true, false, false);
        RingPlot plot = (RingPlot) chart.getPlot();
        plot.setStartAngle(180);
        plot.setCircular(true);
        plot.setSimpleLabels(true);
        plot.setSectionDepth(0.5);
        plot.setBackgroundPaint(Color.WHITE);
        Color invisible = new Color(0xffffffff, true);
        plot.setSectionPaint("", invisible);
        plot.setSectionOutlinePaint("", invisible);
        plot.setShadowPaint(null);
        //plot.setLabelGenerator(null);
        return chart;
    }

    public JPanel createDemoPanel() {
        JFreeChart jfreechart = createChart(createDataset());
        ChartPanel chartPanel = new ChartPanel(jfreechart) {
            @Override
            public Dimension getPreferredSize() {
                return new Dimension(500, 400);
            }
        };
        chartPanel.setLayout(new OverlayLayout(chartPanel));
        JLabel label = new JLabel("BrowserShare");
        label.setFont(label.getFont().deriveFont(48.0f));
        label.setHorizontalAlignment(JLabel.CENTER);
        label.setVerticalAlignment(JLabel.CENTER);
        label.setAlignmentX(0.5f);
        label.setAlignmentY(0.75f);
        label.setOpaque(true);
        label.setBackground(Color.LIGHT_GRAY);
        chartPanel.add(label);
        return chartPanel;
    }

    public static void main(String args[]) {
        EventQueue.invokeLater(() -> {
            JFrame f = new JFrame("Ring Test");
            f.setDefaultCloseOperation(JFrame.EXIT_ON_CLOSE);
            f.add(new RingChartTest().createDemoPanel());
            f.pack();
            f.setLocationRelativeTo(null);
            f.setVisible(true);
        });
    }
}
Upvotes: 1

Reputation: 11
Initial

Refresh

It's quite simple to create a semi/half donut in java using jfreechart. The most important thing is the invisible dataset. My favourite aircraft is the F16 Falcon, but my code below doesn't have any military associations. Feel free to reuse and/or adapt the source code.
Description: Example class to demonstrate semi/half-donut (TAGS: java, osgi, jfreechart, version 1.0.19, SWT, @PostConstruct, ChartComposite, Eclipse, E4, PiePlot, RingPlot, Semi, Half, Example, BackgroundImage, Resizing, Layout)
package de.enjo.jfreechart.semi.donut.example.parts;

import java.awt.image.BufferedImage;
import java.io.ByteArrayInputStream;
import java.io.ByteArrayOutputStream;
import java.io.InputStream;
import java.util.Objects;

import javax.annotation.PostConstruct;
import javax.imageio.ImageIO;
import javax.inject.Inject;

import org.eclipse.core.runtime.IProgressMonitor;
import org.eclipse.core.runtime.IStatus;
import org.eclipse.core.runtime.Status;
import org.eclipse.core.runtime.jobs.Job;
import org.eclipse.e4.ui.di.UISynchronize;
import org.eclipse.jface.layout.GridDataFactory;
import org.eclipse.jface.layout.GridLayoutFactory;
import org.eclipse.jface.resource.ColorRegistry;
import org.eclipse.swt.SWT;
import org.eclipse.swt.graphics.RGB;
import org.eclipse.swt.layout.GridData;
import org.eclipse.swt.widgets.Composite;
import org.jfree.chart.JFreeChart;
import org.jfree.chart.plot.RingPlot;
import org.jfree.data.general.DefaultPieDataset;
import org.jfree.experimental.chart.swt.ChartComposite;

/*
 * Example class to demonstrate semi/half-donut with jfreechart version 1.0.19
 * (SWT, ChartComposite, Eclipse, E4, jfreechart, PiePlot, RingPlot, Semi, Half, Example)
 *
 * @note: This example doesn't use the ChartPanel class to avoid an additional Swing-UI Thread
 * */
public class SamplePart {

    // synchronize ui, i.e. dataset has been changed
    @Inject
    private UISynchronize uiSync;

    // refresh ui job
    private final Job refreshJob = new Job("Refresh Job") {
        @Override
        protected IStatus run(IProgressMonitor monitor) {
            uiSync.asyncExec(SamplePart.this::updateUI);
            return Status.OK_STATUS;
        }
    };

    // invisible dataset, the most important thing
    private final String INVISIBLE = "have_a_look_on_me_if_you_can_xD";

    // an awt image
    private BufferedImage backgroundImage;

    // color white
    private org.eclipse.swt.graphics.Color backgroundColor = new org.eclipse.swt.graphics.Color(255, 255, 255);
    private java.awt.Color whiteColorAlphaChannel = new java.awt.Color(255, 255, 255, 0);

    // swt widget
    private ChartComposite chartComposite;

    // the colors we need/support
    private ColorRegistry colors;

    public SamplePart() {
        colors = new ColorRegistry();
        colors.put("COLOR" + 0, new RGB(0, 0, 255));
        colors.put("COLOR" + 1, new RGB(0, 255, 0));
        colors.put("COLOR" + 2, new RGB(255, 0, 0));
        colors.put("COLOR" + 3, new RGB(0, 255, 255));
        colors.put("COLOR" + 4, new RGB(255, 255, 0));
        colors.put("COLOR" + 5, new RGB(128, 128, 128));
    }

    /**
     * initializing ui & simulate data change via refresh job (delay 3 seconds)
     *
     * @note: wait 3 seconds after starting to refresh
     */
    @PostConstruct
    public void createComposite(Composite parent) {
        initializeExample(parent);
        refreshJob.schedule(3000);// milliseconds
    }

    // construct and set all defaults
    private void initializeExample(Composite parent) {
        parent.setLayout(GridLayoutFactory.fillDefaults().numColumns(1).create());
        parent.setLayoutData(GridDataFactory.fillDefaults().grab(true, true).create());
        parent.setBackground(backgroundColor); // white
        /**
         * 1st load background image
         */
        try {
            // no really military associations
            backgroundImage = loadImage();
        } catch (Exception e) {
            /* ignore , it has to be present */}

        /**
         * 2nd create composite (swt)
         */
        chartComposite = new ChartComposite(parent, SWT.NONE);
        chartComposite.setLayoutData(new GridData(SWT.FILL, SWT.FILL, true, true));
        chartComposite.setDomainZoomable(false);// no zoom needed
        chartComposite.setRangeZoomable(false);// no zoom needed

        /**
         * 3rd create dataset (important thing (...most important thing...*fg))
         *
         * - don't forget to decrease by the previous value (degree of previous value =>
         * array[index-1])
         *
         * - you need an additional, invisible dataset to complete the pie or ring plot
         * up to 100% (360° or 1.0f)
         *
         * FYI: 0.0f-1.0f <> 0%-100% <> 0°-360°
         */
        DefaultPieDataset dataset = new DefaultPieDataset();
        // in this example we use a range of 0°-180°
        int[] degreeValues = new int[] { 45, 90, 135, 180 };// 45°, 90° etc.
        for (int index = 0; index < degreeValues.length; index++) {
            if (index == 0) {
                dataset.setValue(String.valueOf(index), Math.toRadians(degreeValues[index]));
            } else {
                dataset.setValue(String.valueOf(index), Math.toRadians(degreeValues[index] - degreeValues[index - 1]));
            }
        }
        // MOST IMPORTANT
        // invisible dataset to complete pie chart up to 100%
        // you can use any other numbered key here, in my case the key is named:
        // have_a_look_on_me_if_you_can_xD (should be unique)
        dataset.setValue(INVISIBLE, Math.toRadians(180));// semi => 180°, we have 360° now

        /**
         * 4th create plot & chart
         */
        final RingPlot plot = new RingPlot(dataset);
        plot.setOutlineVisible(false);
        plot.setLabelGenerator(null);
        for (int index = 0; index < degreeValues.length; index++) {
            plot.setSectionPaint(String.valueOf((index)), getAWTColor(index));
            // section stroke line for better visibility
            plot.setSectionOutlinePaint(String.valueOf((index)), new java.awt.Color(213, 54, 0));
        }
        // MOST IMPORTANT
        // invisible section to complete pie chart up to 100%
        // you can use any other numbered key here, in my case the key is named:
        // have_a_look_on_me_if_you_can_xD (should be unique)
        plot.setSectionPaint(INVISIBLE, whiteColorAlphaChannel); // 180° alpha invisible
        plot.setSectionOutlinePaint(INVISIBLE, whiteColorAlphaChannel); // 180° alpha invisible
        //
        plot.setBackgroundImage(backgroundImage);// you can also use a picture of your grandma ^^
        plot.setBackgroundImageAlpha(1.0f); // background image without transparent channel
        plot.setForegroundAlpha(0.5f); // plots drawing with transparent channel (semi)
        plot.setSectionDepth(0.9D);// ring depth/width in double
        plot.setCircular(true); // no ellipse
        plot.setInnerSeparatorExtension(0.2f);// percent of inner separator strokes
        plot.setOuterSeparatorExtension(0.2f);// percent of outer separator strokes
        plot.setSectionOutlinesVisible(true);// strokes between datasets
        plot.setSeparatorPaint(new java.awt.Color(213, 54, 0)); // stroke paint
        plot.setShadowPaint(null);// no shadow drawing needed (i'm always on the bright side of life... :P)
        /**
         * @note: edit image to correct size and position of AOI (area-of-interest)
         *        first before use these settings
         *
         * @note: setBackgroundImageAlignment(0) = resize of image is disabled. Comment
         *        it out to enable auto resizing (not recommended in this case)
         */
        plot.setInteriorGap(0.0D);
        plot.setBackgroundImageAlignment(0);
        //
        final JFreeChart chart = new JFreeChart(null, null, plot, false);
        chart.setBackgroundPaint(new java.awt.Color(parent.getBackground().getRed(), parent.getBackground().getGreen(),
                parent.getBackground().getBlue()));

        /*
         * 5th complete initialization
         */
        chartComposite.setChart(chart);
    }

    private java.awt.Color getAWTColor(int index) {
        /*
         * ensure that dataset size/length does not exceed the color size/length
         */
        org.eclipse.swt.graphics.Color color = colors.get("COLOR" + index);
        return new java.awt.Color(color.getRed(), color.getGreen(), color.getBlue());
    }

    // is called by the refresh job
    public void updateUI() {
        // simulate date change
        if (Objects.nonNull(chartComposite) && !chartComposite.isDisposed()) {
            chartComposite.setRedraw(false);
            DefaultPieDataset dataset = new DefaultPieDataset();
            // in this example we use a range 0°-180°, 6 colors are supported
            int[] degreeValues = new int[] { 30, 60, 90, 120, 150, 180 };// 30°, 60° etc.
            for (int index = 0; index < degreeValues.length; index++) {
                if (index == 0) {
                    dataset.setValue(String.valueOf(index), Math.toRadians(degreeValues[index]));
                } else {
                    dataset.setValue(String.valueOf(index),
                            Math.toRadians(degreeValues[index] - degreeValues[index - 1]));
                }
            }
            // MOST IMPORTANT
            // invisible dataset to complete pie chart up to 100%
            // you can use any other numbered key here, in my case the key is named:
            // have_a_look_on_me_if_you_can_xD (should be unique)
            dataset.setValue(INVISIBLE, Math.toRadians(180));// semi => 180°, we have 360° now
            ((RingPlot) chartComposite.getChart().getPlot()).setDataset(dataset);
            chartComposite.setRedraw(true);
        }
    }

    /*
     * ############################# helper area ############################
     */

    private BufferedImage loadImage() throws Exception {
        /**
         * @note: image source:
         *        https://www.pngarea.com/view/e6f205a3_jet-png-f-16-plane-png-transparent-png/
         *
         * @note: put this image into the icons directory, named "f16.png" and replace
         *        transparent background with white background color first
         *
         * @note: this example has no military associations. I like this aircraft, not
         *        more :). You can use every other image with white background in this
         *        example
         */
        return getBufferedImage(SamplePart.class.getResourceAsStream("/icons/f16.png"));
    }

    private BufferedImage getBufferedImage(InputStream inputStream) throws Exception {
        byte[] bytes = read(inputStream);
        return getBufferedImage(bytes);
    }

    /*
     * load resources without additional plugins, like emf etc.
     */
    private byte[] read(InputStream is) throws Exception {
        ByteArrayOutputStream buffer = new ByteArrayOutputStream();
        int nRead = 0;
        byte[] data = new byte[is.available()];
        while ((nRead = is.read(data, 0, data.length)) != -1) {
            buffer.write(data, 0, nRead);
        }
        buffer.flush();
        byte[] bytes = buffer.toByteArray();
        buffer.close();
        is.close();
        return bytes;
    }

    private BufferedImage getBufferedImage(byte[] bytes) throws Exception {
        InputStream is = new ByteArrayInputStream(bytes);
        BufferedImage bufferedImage = ImageIO.read(is);
        is.close();
        return bufferedImage;
    }
}
Upvotes: 1
Related Questions
- Problem implementing JFreeChart
- Java data visualization
- jfree charts sample tutorial
- Pretty pie charts in JFreechart
- Java and JFreechart panel
- Jfreechart piechart generation
- Java JFreeChart Not fully displaying chart in JPanel
- Java Free Chart Question
- dynamic generation of jfree chart -pie chart
- jFreeChart: Is this kind of chart possible?