
Reputation: 8403
Logarithmic y-axis Tick Marks in R plot() or ggplot2()
I saw the ideal tick-mark structure for a log="y" plot in this paper, Figure 3b 3c 3d.
It has short, log-spaced minor tick marks without labels, plus long, log-spaced major tick marks with labels.
Does anyone know how to achieve this in R?
Upvotes: 12
Views: 16333
Answers (4)

Reputation: 1135
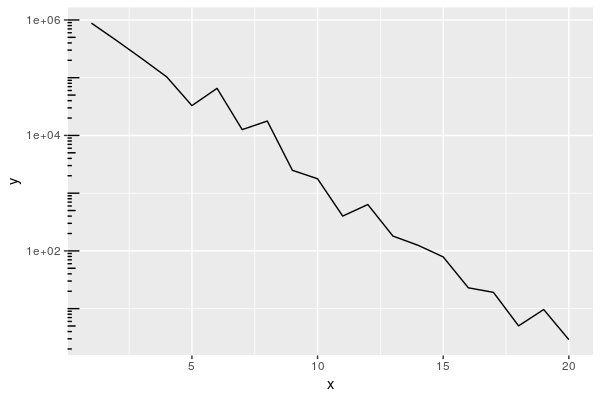
Here is a ggplot2 solution:
library(ggplot2)

set.seed(20180407)

df = data.frame(x = seq(from = 1, by = 1, length.out = 20),
                y = 2^(seq(to = 1, by = -1, length.out = 20) + rnorm(20, 0, 0.7)))

ggplot(data = df, aes(x = x, y = y)) +
  geom_line() +
  scale_y_log10() +
  annotation_logticks(sides = "l")
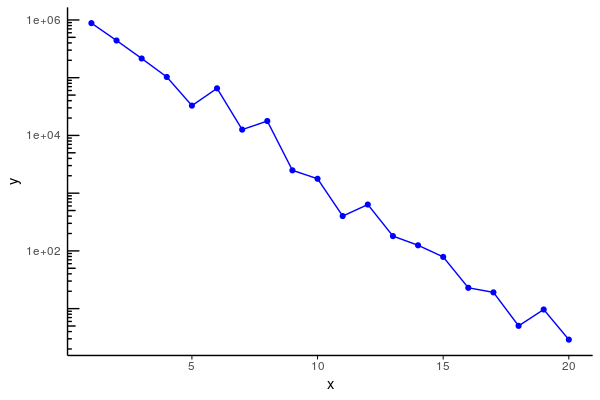
You can make it look even more than the paper you linked to with some theming:
ggplot(data = df, aes(x = x, y = y)) +
  geom_line(colour = "blue") +
  geom_point(colour = "blue") +
  scale_y_log10() +
  annotation_logticks(sides = "l") +
  theme_minimal() +
  theme(panel.grid = element_blank(),
        axis.line = element_line(),
        axis.ticks.x = element_line())
Upvotes: 1

Reputation: 37824
In base R just build the axes however you want. Something like this could be a start.
set.seed(5)
d <- data.frame(x=1:100, y=rlnorm(100, meanlog=5, sdlog=3))
with(d, {
  plot(x, y, log="y", yaxt="n")
  y1 <- floor(log10(range(y)))
  pow <- seq(y1[1], y1[2]+1)
  ticksat <- as.vector(sapply(pow, function(p) (1:10)*10^p))
  axis(2, 10^pow)
  axis(2, ticksat, labels=NA, tcl=-0.25, lwd=0, lwd.ticks=1)
})
In lattice, the latticeExtra package has the capability:
library(lattice)
library(latticeExtra)
xyplot(y~x, data=d, scales=list(y=list(log=10)),
       yscale.components=yscale.components.log10ticks)
Upvotes: 11

Reputation: 263481
This has been done in package::sfsmisc. See the example in help(axTexpr)
Upvotes: 4

Reputation: 121177
For ggplot2, it seems that the only option you have for specifying ticks is the size (i.e., width).
# A plot of any old data
dfr <- data.frame(x = 1:100, y = rlnorm(100))
p <- ggplot(dfr, aes(x, y)) +
  geom_point() +
  scale_y_log10(breaks = breaks, labels = breaks)


#Tick locations
get_breaks <- function(x)
{
  lo <- floor(log10(min(x, na.rm = TRUE)))
  hi <- ceiling(log10(max(x, na.rm = TRUE)))
  as.vector(10 ^ (lo:hi) %o% 1:9)
}

breaks <- get_breaks(dfr$y)
log10_breaks <- log10(breaks)

#Some bigger ticks
p + opts(axis.ticks = theme_segment(
    size = ifelse(log10_breaks == floor(log10_breaks), 2, 1)
  ))
Upvotes: 6
Related Questions
- R+ggplot2: adding log tick marks to a histogram
- How can I put log tickmarks on a secondary axis?
- Logarithmic axis with modified ticks
- R ggplot2: custom y-axis tick labels for log-transformed data?
- log-log scale y axis ggplot
- Displaying minor logarithmic ticks in x-axis in R
- Plotting longer ticks for y-axis at logarithmic scale with ticks pointing outward
- R: custom tick markers for y-axis using log10 scale in ggplot
- ggplot2: how to draw horizontal line on plot in log scale
- ggplot2 y-axis ticks not showing up on a log scale