
crock1255
Reputation: 1085
Color Barplot by Count
I am creating a barplot in R and want to color each bar by bar height (count)
Currently what I have:
z=rnorm(n,1)
Z=runif(n)
h=barplot(Z)
I have pictures but not enough reputation to post them. So here is the example in MatLab: MatLab-Color bars by height
Upvotes: 5
Views: 3818
Answers (2)

joran
Reputation: 173577
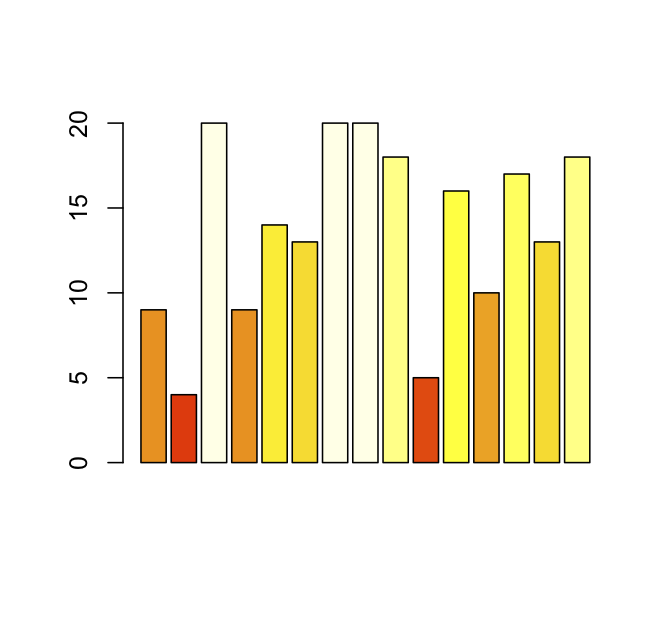
In addition to baptiste's ggplot2 solution, here's a simple example using barplot:
Z <- sample(20,15,replace = TRUE)
barplot(Z,col = heat.colors(max(Z))[Z])
which produces something like this:
Upvotes: 7

baptiste
Reputation: 77106
Try this,
library(ggplot2)
d = data.frame(x = rnorm(100))
ggplot(d) + geom_bar(aes(x, fill = ..count..))
Upvotes: 5
Related Questions
- Bar plot for count data by group in R
- How to manually change the fill color of barplot when stat='count' in ggplot2
- How to draw a barplot from counts data in R?
- How to change colors on barplot?
- Barplot with defined colour per bar
- barplot color by values in R
- Colouring barplot in R according to variable of data set
- R plot with counting
- Color in BarPlots
- R color Barchart