
Reputation: 1725
Exponential form of tick marks for log plot in Mathematica
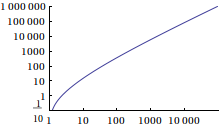
In an attempt to learn more Mathematica, I am trying to reproduce the tick marks on this log (log) plot:
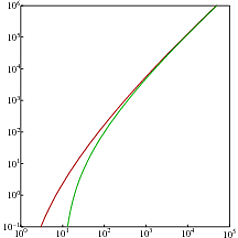
This is as close as I can get:
LogLogPlot[Log[x!], {x, 1, 10^5}, PlotRange -> {{0, 10^5}, {10^-1, 10^6}}, Ticks -> {Table[10^i, {i, 0, 5}], Table[10^i, {i, -1, 6}]}]
Question
How can I make tick marks that are always of the form 10^n for appropriate values of n?
Upvotes: 14
Views: 9142
Answers (4)

Reputation: 42225
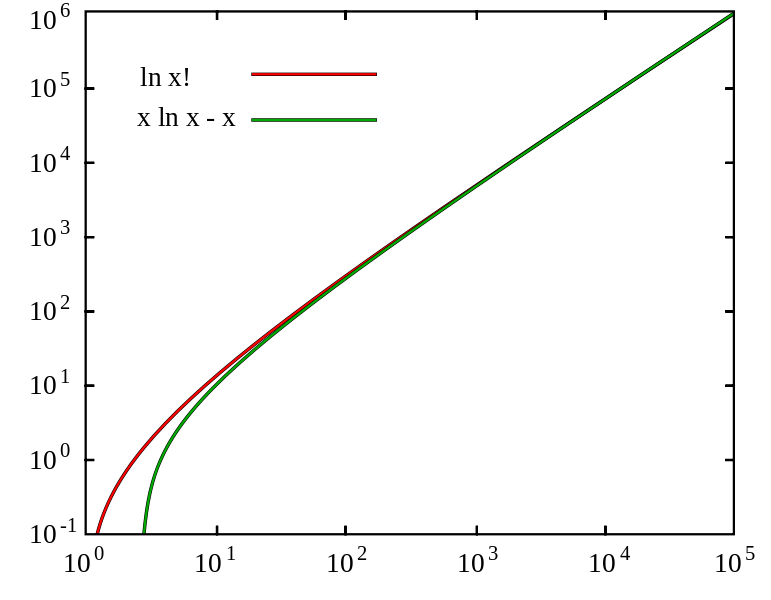
LevelScheme is a package for Mathematica that makes making such plots very easy, fully customizable and professional looking. I'm very certain that if your plot was made in mathematica, it was using LevelScheme. Here's my reproduction of your plot in Mathematica using LevelScheme
<<LevelScheme`;
Figure[{
    FigurePanel[{{0,1},{0,1}},
            PlotRange->{{0,5},{-1,6}},
            FrameTicks->{
                        LogTicks[0,5,ShowMinorTicks->False],
                        LogTicks[-1,6,ShowMinorTicks->False]
                    }
    ],
    RawGraphics[
        LogLogPlot[{Log[x!],x Log[x]-x},{x,1,10^5},
                PlotRange->{{0,10^5},{10^-1,10^6}},
                PlotStyle->Darker/@{Red,Green}
            ]
    ]
}, PlotRange->{{-0.1,1.04},{-0.05,1.025}},ImageSize->300{1,1}]
Upvotes: 3

Reputation: 24420
To expand on the previous answers, you can calculate the right range for the Tables in the Ticks option automatically by doing something like
ticksfun[xmin_, xmax_] :=
 Table[{10^i, Superscript[10, i]}, {i, Floor[Log10[xmin]],
   Ceiling[Log10[xmax]]}]

LogLogPlot[Log[x!], {x, 1, 10^5},
 PlotRange -> {{0, 10^5}, {10^-1, 10^6}},
 Ticks -> {ticksfun, ticksfun}]
Upvotes: 4

Reputation: 8567
Superscript, the generic typesetting form without any built-in meaning, is your friend for this.
LogLogPlot[Log[x!], {x, 1, 10^5},
   PlotRange -> {{0, 10^5}, {10^-1, 10^6}},
   Ticks -> {
       Table[{10^i, Superscript[10, i]}, {i, 0, 5}],
       Table[{10^i, Superscript[10, i]}, {i, -1, 6}]
       }
   ]
Upvotes: 14

Reputation: 50858
You can specify the label for a given tick, by giving a 2-tuple of {value, label} instead of giving just giving a value.
This still leaves us with the conundrum of how to maintain the 10^n-form.
To do this, we observe, that using Defer makes the 10^i retain its form. However, we still need to Evaluate the i inside of it, as otherwise we just get a bunch of 10^i-labels.
Example:
In[19]:= Table[10^i, {i, 0, 6}]

Out[19]= {1, 10, 100, 1000, 10000, 100000, 1000000}

In[18]:= Table[10^Defer[i], {i, 0, 6}]

Out[18]= {10^i, 10^i, 10^i, 10^i, 10^i, 10^i, 10^i}

In[17]:= Table[10^Defer[Evaluate[i]], {i, 0, 6}]

Out[17]= {10^0, 10^1, 10^2, 10^3, 10^4, 10^5, 10^6}
Using this, we can now do the following to get a solution:
LogLogPlot[Log[x!], {x, 1, 10^5},
 PlotRange -> {{0, 10^5}, {10^-1, 10^6}},
 Ticks -> {Table[{10^i, 10^Defer[Evaluate [i]]}, {i, 0, 5}],
   Table[{10^i, 10^Defer[Evaluate [i]]}, {i, -1, 6}]},
 TicksStyle -> StandardForm]
Upvotes: 2
Related Questions
- How to have log tick marks face inward?
- Set custom scientific notation y tick on log-plot
- Displaying minor logarithmic ticks in x-axis in R
- Showing more ticks labels on log plot
- How to set the ticks of log scale for x&y axis?
- Logarithmic y-axis Tick Marks in R plot() or ggplot2()
- Matplotlib logarithmic axis ticks
- How to set the ticks on a logarithmic axis in matplotlib
- Loglog plot with linear ticks on x-axis
- Python, matplotlib: how to set tick label values to their logarithmic values